EMOSTM - Energy Monitoring System
Chillers are known to be one of the largest consumers of energy. Therefore, monitoring their efficiency is crucial to ensure that they perform up to the mark. Although there are several maintenance software available on the market for large buildings, CET ENVIRO has developed a unique, affordable, and user-friendly monitoring system that accurately indicates the efficiency of a chiller online. This system calculates the KW per hour the chiller consumes in proportion to the duration it takes to produce a fixed amount of tonnes.
With smart analytical tools provided through a web-based software, you can easily monitor the efficiency of large chillers and optimise their performance. In many cases, simply monitoring and optimising the performance of chillers can lead to a 5-10% reduction in energy consumption. Our monitoring system offers fast installation, affordable pricing, and an easy-to-use interface.
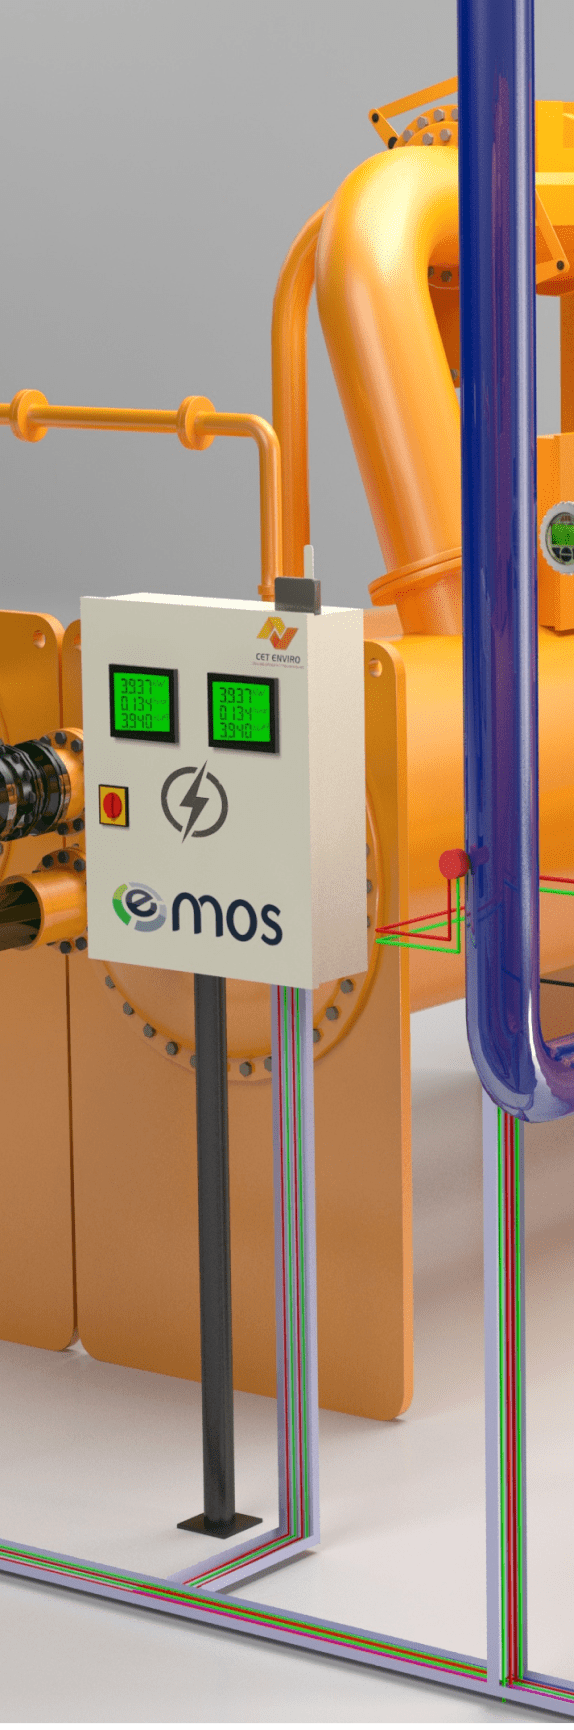
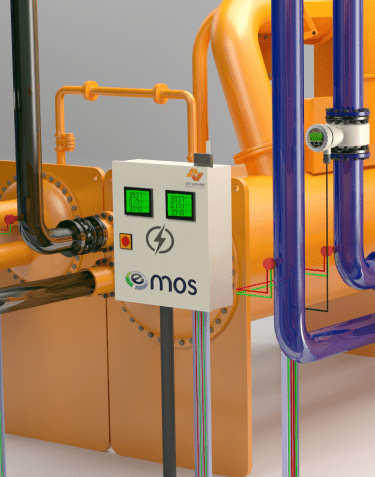
EMOSTM has highly efficient magnetic flow-meters installed in each chiller to measure instant flow. Temperature Sensors (PT100) are installed in inlet and outlet of the Evaporators and Condensers. Instant data values from the Flowmeters and temperature sensors are sent to the Control Panel through communication cables. Individual KWh meter is installed to measure the instant electrical power consumption of each chiller and values are recorded in control panel.
The data collected from Flow-meters, Temperature sensors, KWh meter is collated in specialised Control Panel to calculate specific power consumption of chillers in ikW/TR. These values are automatically retrieved ad updated for real time, average day/monthly trend analysis and report generation on i-cloud server.
Energy Saving potential in chillers
Chillers are the biggest contributor to energy costs in HVAC.
Your plug and play solution makes chiller performance more visible
Energy Monitoring System (EMOSTM) is the most effective and reliable system that automatically records specific power consumption of chillers in most accurate way 24×7.
Save at-least 5% to 7% in chiller energy use. EMOSTM will continuously collect, analyse and report on chiller operating data through the internet facility integrated in EMOSTM system and connected to cloud-based server.
The critical information collected at server can be used to manage energy and operating costs on routine basis and this significantly helps in improving the performance potential of chiller.
EMOSTM Features

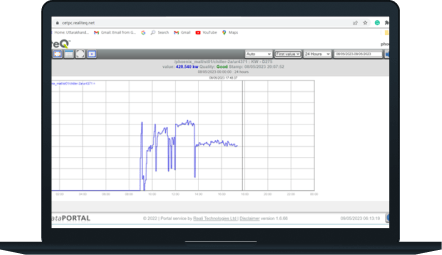
Cloud-based, Real-time measurement

Multiple user access

Automatic email alerts

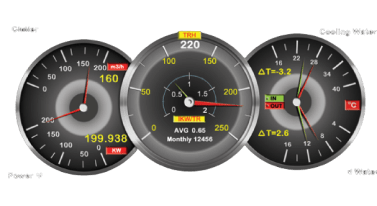
Easy dashboards to make equipment performance more visible

Detailed data generation and analysis reports

Compatible with any building HVAC system and lower lifecycle costs
Optimize Chiller Plant Efficiency
- TRH of individual chiller vis-a-vis design / benchmark
- KWh of individual chiller vis-a-vis design / benchmark
- Delta Temperatures for Chilled water & Condenser water
- Efficiency of Chilled water pumps
- Cooling Tower effectiveness
Improve Energy Performance and Save money
- TRH & KWh Consumption and average cumulative data for daily, monthly and yearly, along with generation & consumption benchmarking